Chapter 3: Lumen Your First 15 Minutes
This chapter walks you through your first workflow from start to finish. By the time you finish the reading, you will have significant ideas on how to get a real output from Lumen, you will understand what the sections mean, and you will know what to do next.
The example uses Helix — the AI-native PM platform introduced in the Preface — with PostHog and Supabase connected.
Step 1: Pick Your Starting Point
Choose the workflow that matches where you are right now.
For this walkthrough, run W1 PMF Discovery. It is the best starting workflow for most new Lumen users because it covers the most ground and produces the richest output.
Step 2: Run the Command
In Claude Code, type:
/lumen:pmf-discovery
Lumen runs a PostHog connection check and then asks one question:
[LUMEN] SetupGuide · All required MCPs connected ✓
[LUMEN] Loading W1 — PMF Discovery
Which customer segments should I analyse?
(e.g. "SMB, mid-market, enterprise" or "self-serve, sales-assisted")
[Type "all" or "same as last time" if unchanged]
Answer with your actual segments. For Helix:
> Solo plan users (free), Team plan users ($49/seat), Org plan users (enterprise)
That is the only intake question. Lumen takes it from there.
Step 3: Watch the Agent Sequence Run
After you answer, agents run in sequence. Each one announces itself, does its work, and hands off to the next. You do not need to do anything until an oversight gate appears.
[LUMEN] EventIQ · Validating event schema...
✓ Business model confirmed: B2B SaaS
⚠ compliance_flags: [GDPR] — EU user base is 34% of MAU
[LUMEN] SignalMonitor · Scoring PMF by segment...
✓ PostHog connected · Cohort data: 90 days
  Solo plan:    PMF score 29/100 · Status: WEAK
  Team plan:    PMF score 58/100 · Status: CONFIRMED
  Org plan:     PMF score 41/100 · Status: CONFIRMED (weak)
[LUMEN] DiscoveryOS · Building opportunity tree...
✓ Synthesizing 14 interview transcripts
✓ Opportunity solution tree generated
[LUMEN] MarketIQ · Mapping competitive landscape...
✓ 6 competitors identified
✓ Moat assessment: Data advantage (MEDIUM), Switching costs (HIGH)
[LUMEN] DecideWell · Structuring recovery path decision...
At this point, Lumen pauses for a Level 2 approval gate. This is expected. Chapter 6 covers oversight gates in detail. For now, respond as shown:
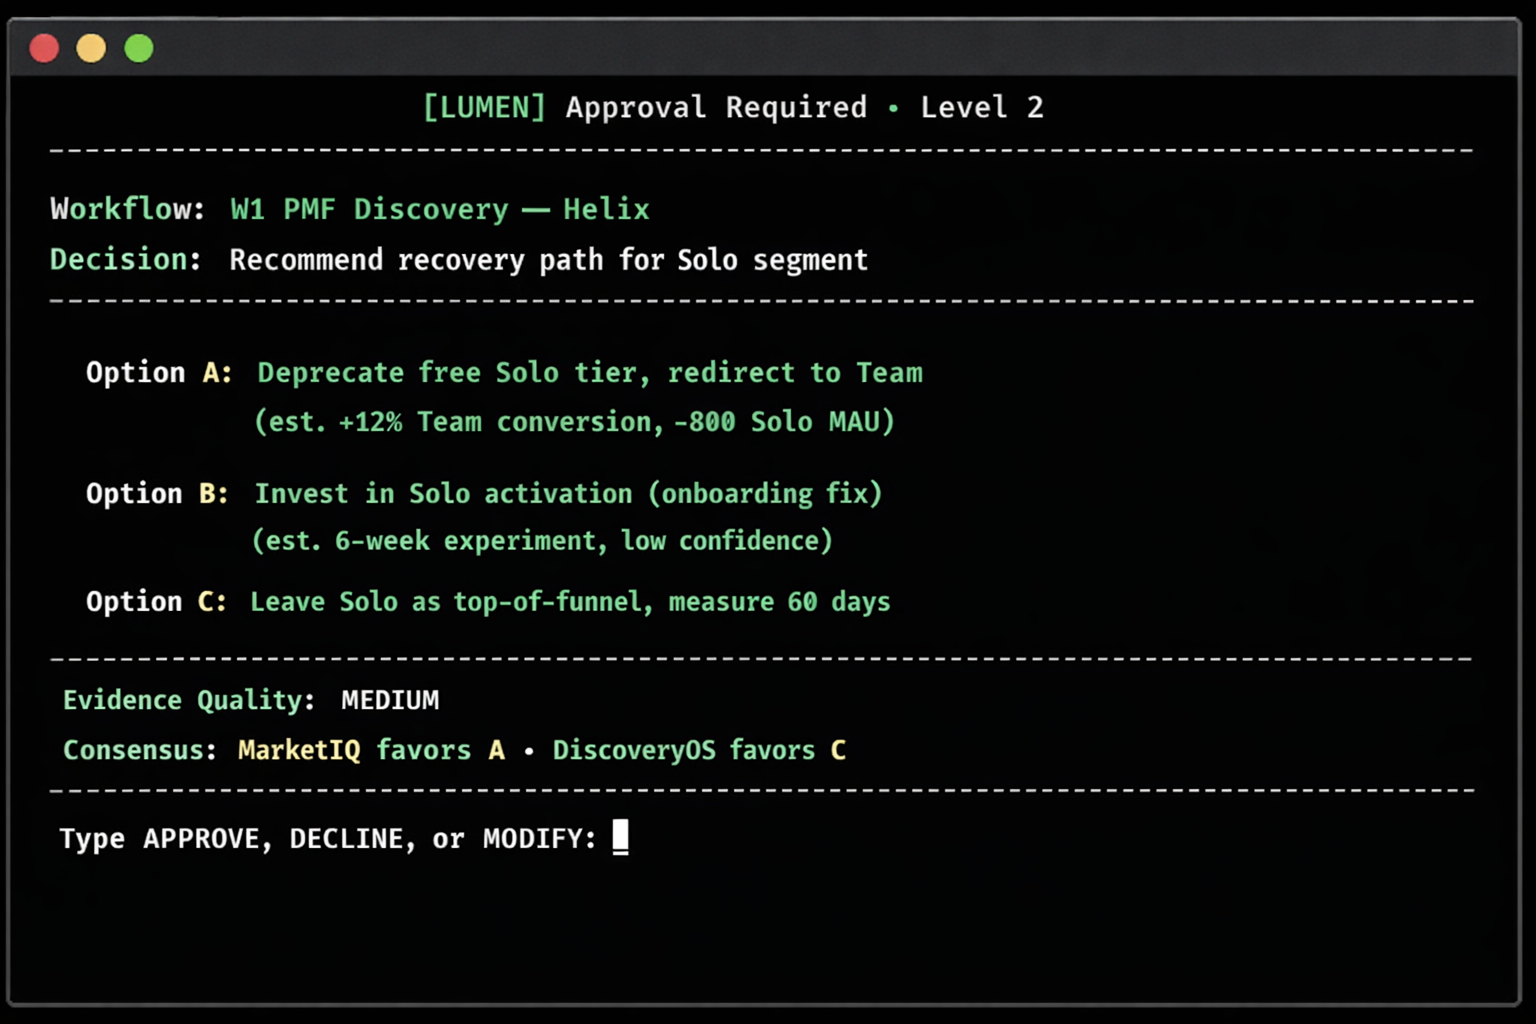
Type your response:
> APPROVE
Or if you want to add a constraint:
> MODIFY: We cannot deprecate the free tier before Q3. Evaluate Option B and C only.
After you respond, the workflow continues:
[LUMEN] DecideWell · Decision recorded. Proceeding with Options B and C.
[LUMEN] RoadMap · Building 0–90 day recovery roadmap...
✓ Quarterly roadmap generated (committed /likely/exploratory)
[LUMEN] HypothesisLab · Designing experiments...
✓ 2 experiments designed with power calculations
✓ Minimum detectable effect: 8% activation improvement (n=620, 4 weeks)
[LUMEN] Orchestrator · Aggregating evidence and generating report...
Step 4 — Read the Report
The report appears inline. It has five sections.
Summary — Two to three paragraphs covering the key findings. Read this first.
PMF Scores by Segment — The SignalMonitor output. Each segment has a score, a status (CONFIRMED / WEAK / NOT FOUND), and a short interpretation.
Opportunity Tree — The DiscoveryOS output. Ranked opportunities mapped to user jobs, pains, and evidence.
Decision Memo — The DecideWell output. The recommended path, the alternatives considered, and the outcome tracking ID (used for 30/60/90-day follow-up).
Experiment Briefs — The HypothesisLab output. Each experiment has a hypothesis, a success metric, a sample size, and a time estimate.
At the top of every section, you will see an evidence quality badge:
PMF Scores by Segment  [Evidence: HIGH]
Opportunity Tree       [Evidence: MEDIUM]
Decision Memo          [Evidence: MEDIUM]
Overall                [Evidence: MEDIUM]
The overall grade is the lowest individual grade across all sections. In this case, DiscoveryOS ran with 14 interviews — solid but not at saturation — so the opportunity tree is MEDIUM and pulls the overall down.
The Limitations section is at the bottom. Read it. It tells you exactly what would have made this report better: more interviews, HubSpot churn signals, or a longer PostHog cohort window.
Step 5: Know What to Do Next
After your first W1 run, three things are worth doing.
Review the decision memo and mark your outcome tracking ID. If Supabase is connected, the decision is already in the Knowledge Graph. If not, copy the outcome tracking ID from the report and note it somewhere. You will use it when you re-run SignalMonitor in 30 days.
Close the gaps in the Limitations section. If the report says "HubSpot churn signals unavailable," that is the next MCP to connect. The next run will be more accurate.
Run the experiment the report designed. HypothesisLab outputs a complete experiment brief. It includes the hypothesis, the success metric, the sample size, the minimum detectable effect, and the estimated run time. Take it straight to your engineering partner.
That is the first 15 minutes. The rest of the guide goes deeper on every part.